Graphing: independent and dependent variables
Key Questions
-
Dependent variables are properties that change in response to a change in another property.
Scientists try to determine if a change to one property causes something else to change in a predictable way.
These changing quantities are the variables.
The independent variables are the ones that are tested to see if they are the cause.
The dependent variables are the properties that change when the independent variables change.
For example, you want to find out if you can use a person’s height to determine arm span.
You collect a sample of people and measure their heights (the independent variable). Then you measure their arm spans (the dependent variable). Is a change in the independent variable related to a change in the dependent variable?
To answer this question, you plot a graph with the independent variable along the x-axis and the dependent variable along the y-axis. Your graph might look like this.
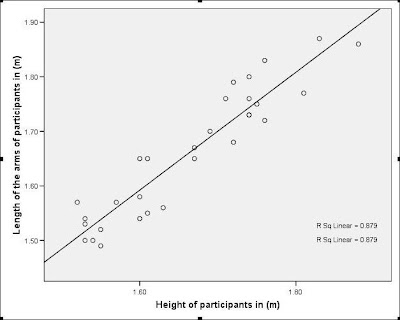
You can draw a “best fit” line through the points. This indicates that the dependent variable (arm span) depends on the person’s height.
 Ernest Z.
·
·
Mar 21 2014
Ernest Z.
·
·
Mar 21 2014
-
The independent variable should be plotted on the x-axis. The dependent variable should be plotted on the y-axis.
The graph of mass vs. volume places volume on the x-axis and the mass on the y-axis. The value of graphing this relationship is best understood by considering the following equation
#D=m/v# Note the slope of your graph will be
#(rise)/(run)# which is#(mass)/(volume)# which is the density of the material.If you need to plot data using Excel and analyze using linear regression, here is a helpful video
 mrpauller.weebly.com
·
2
·
Mar 27 2014
mrpauller.weebly.com
·
2
·
Mar 27 2014
-
An independent variable is the variable you have control over, what you can choose and manipulate.
Example: You are interested in how stress affects heart rate in humans. Your independent variable would be the stress and the dependent variable would be the heart rate. You can directly manipulate stress levels in your human subjects and measure how those stress levels change heart rate.
A dependent variable is the variable being tested in a scientific experiment.
The dependent variable is 'dependent' on the independent variable. As the experimenter changes the independent variable, the change in the dependent variable is observed and recorded.
A scientist is testing the effect of number of hours spend in gym on the amount of muscle developed. The independent variable is the number of hours in gym (deliberately changed) and the amount of muscles developed is the dependent variable.
 Manish Bhardwaj
·
2
·
Mar 23 2014
Manish Bhardwaj
·
2
·
Mar 23 2014