What does the signal from NMR spectrometer look like?
1 Answer
An NMR spectrum looks like a series of peaks on a graph.
Nuclei like ¹H and ¹³C have a magnetic moment. When you put them in an external magnetic field, they can line up either with or against the field.
If you then apply a radiofrequency field, some nuclei absorb energy and jump to the higher energy level (against the field).
When they return to the lower level, they emit quanta of energy at specific frequencies.
A receiver detects this energy and a computer plots a graph of intensity vs. frequency.
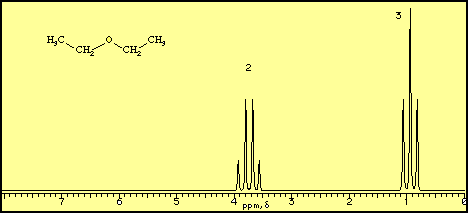
A proton NMR spectrum of diethyl ether looks like this.

The horizontal axis is in units of δ or ppm "downfield" from a reference point at δ = 0. The vertical axis is in units of relative intensity.
We see signals centred at δ 0.92 and 3.75 with area ratios of 3:2. These correspond to the CH₃ and CH₂ groups in the molecule.
Each signal is split into "multiplets". These give more information on the structure of the molecule.
A ¹³C NMR spectrum of diethyl ether looks like this.

The signals are so narrow that they look like vertical lines, and they are not split into multiplets.
The spectrum tells us that there are two different environments for the carbon atoms in the molecule.

