How do you graph x=8 by plotting points?

1 Answer
Nov 23, 2015

A vertical line 8 units to the right of the origin.

Explanation:

This is an odd graph.

Think about what it's saying: x=8. This means that NO MATTER WHAT, x HAS TO equal 8.

Notice that y is not even mentioned in the equation. Therefore, y is irrelevant! The only thing that matters is that x=8.

Therefore, points you could plot would be anything in the form (8,y). You could plot (8,0),(8,-4),(8,61), or (8,-pi).

It would look like a vertical line:
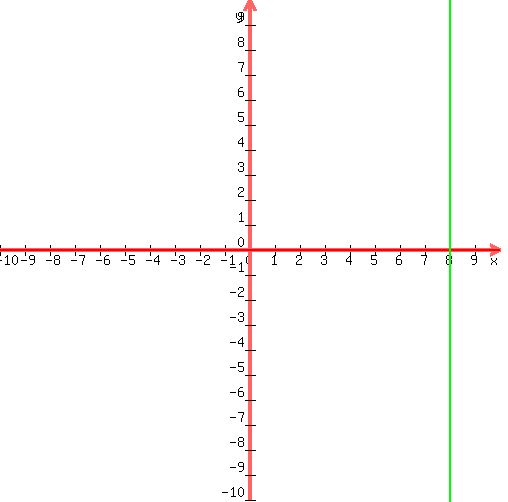
![algebra.com](https://useruploads.socratic.org/ZgnsRuQQ6KlYHBxjdwCW_plot-formula.mpl)

Note that any graph x=a where a is just a number is a vertical line. Similarly, any graph of y=a is just a horizontal line.