Write 2 experiments that proves that oxygen is used up in respiration.Explain in detail how does this done and what are the things used?
1 Answer


One method is using a respirometer with woodlice or another small organism inside it, another method is using a spirometer
Explanation:
Respirometer apparatus can be set up as shown:
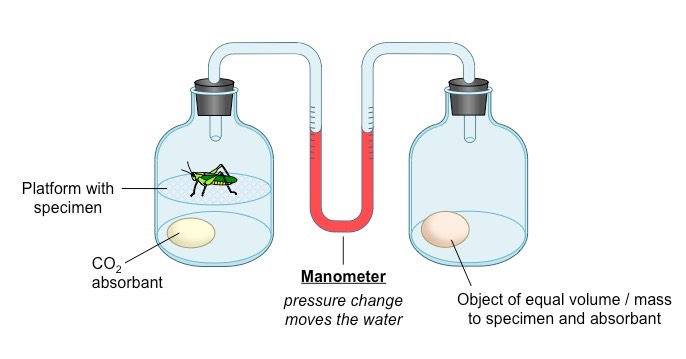 This involves two containers, connected by a capillary tube containing a coloured fluid (a manometer).
A live organism (eg a woodlouse) is placed in one container, along with a
A glass bead of equal mass and volume is placed in the other container to ensure both containers are identical in every way other than the presence of the organism, so that the only variable is the amount of
As the organism present respires, it will consume
Similarly, spirometer apparatus can be set up as shown:
 )
)
A spirometer works in much the same way as a respirometer. A patient inhales in and out of the mouthpiece. Any
An image trace as shown is produced:
 )
)
As the patient exhales, the volume of the spirometer increases, and vice versa as the patient inhales. This causes the peaks and troughs shown on the graph. The average volume of the spirometer gradually decreases as
The rate at which the graph decreases (ie the gradient of the trend line) can be found - this gives a rate for average
