How do you read phase diagrams?
1 Answer
Correctly....
Explanation:
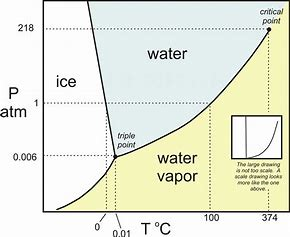
Let us look at a phase diagram of WATER and see if we make some sense from it....typically pressure is plotted against temperature....and we can read the resultant phase given the two coordinates.

The scale of the
At lower temperatures, say at
At much lower pressures, we find the triple point, the conditions of temperature and pressure at which ALL three phases are in equilibrium...
Of special significance for the water molecule is that the SLOPE of the line differentiating the solid phase, and the liquid phase is NEGATIVE. This is very unusual....but we need further information from the Clapeyron equation to determine its significance....to put it in a nutshell, this means that the density of the solid phase is LESS than the density of the liquid phase, and so ice-bergs float....
Anyway, we are flying blind a bit here. If there is a specific issue or query raise it, and someone will address it. I would also consult your text for its account of phase diagrams.

