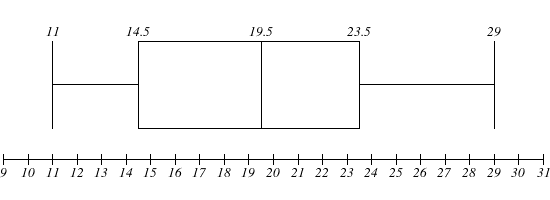
How do you make a box-and-whisker plot of the data 24, 18, 29, 21, 16, 23, 13, 11 ?
1 Answer
Oct 30, 2017
First we order the data:
# 11, 13, 16, 18, 21, 23, 24, 29 #
Now we establish the quartiles (average):
# Q_1 = 1/2(13+16) = 14.5#
# Q_2 = 1/2(18+21) = 19.5#
# Q_3 = 1/2(23+24) = 23.5#
Which then allows us draw the box and whisper plot:


