How do I graph the quadratic equation #y=(x-1)^2# by plotting points?
1 Answer

Plotting ordered pairs is a very good place to start learning about the graphs of quadratics!
In this form,
When you solve that equation, it gives you the x-value of the vertex. This should be the "middle" value of your list of inputs so that you can be sure to get the symmetry of the graph well displayed.
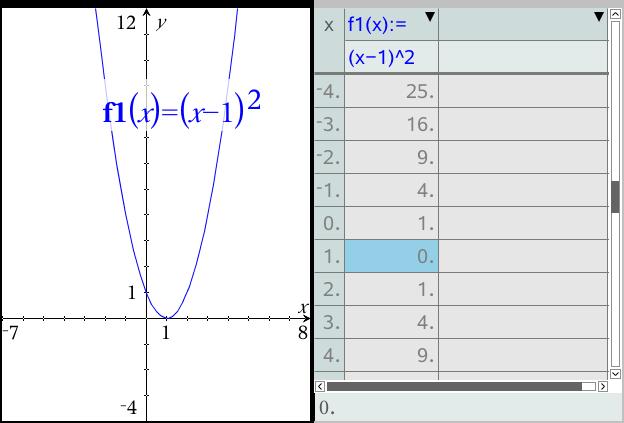
I used the Table feature of my calculator to help, but you can substitute the values in by yourself to get the ordered pairs:
for x = 0:
for x = -1:
for x = 2:
and so on.
