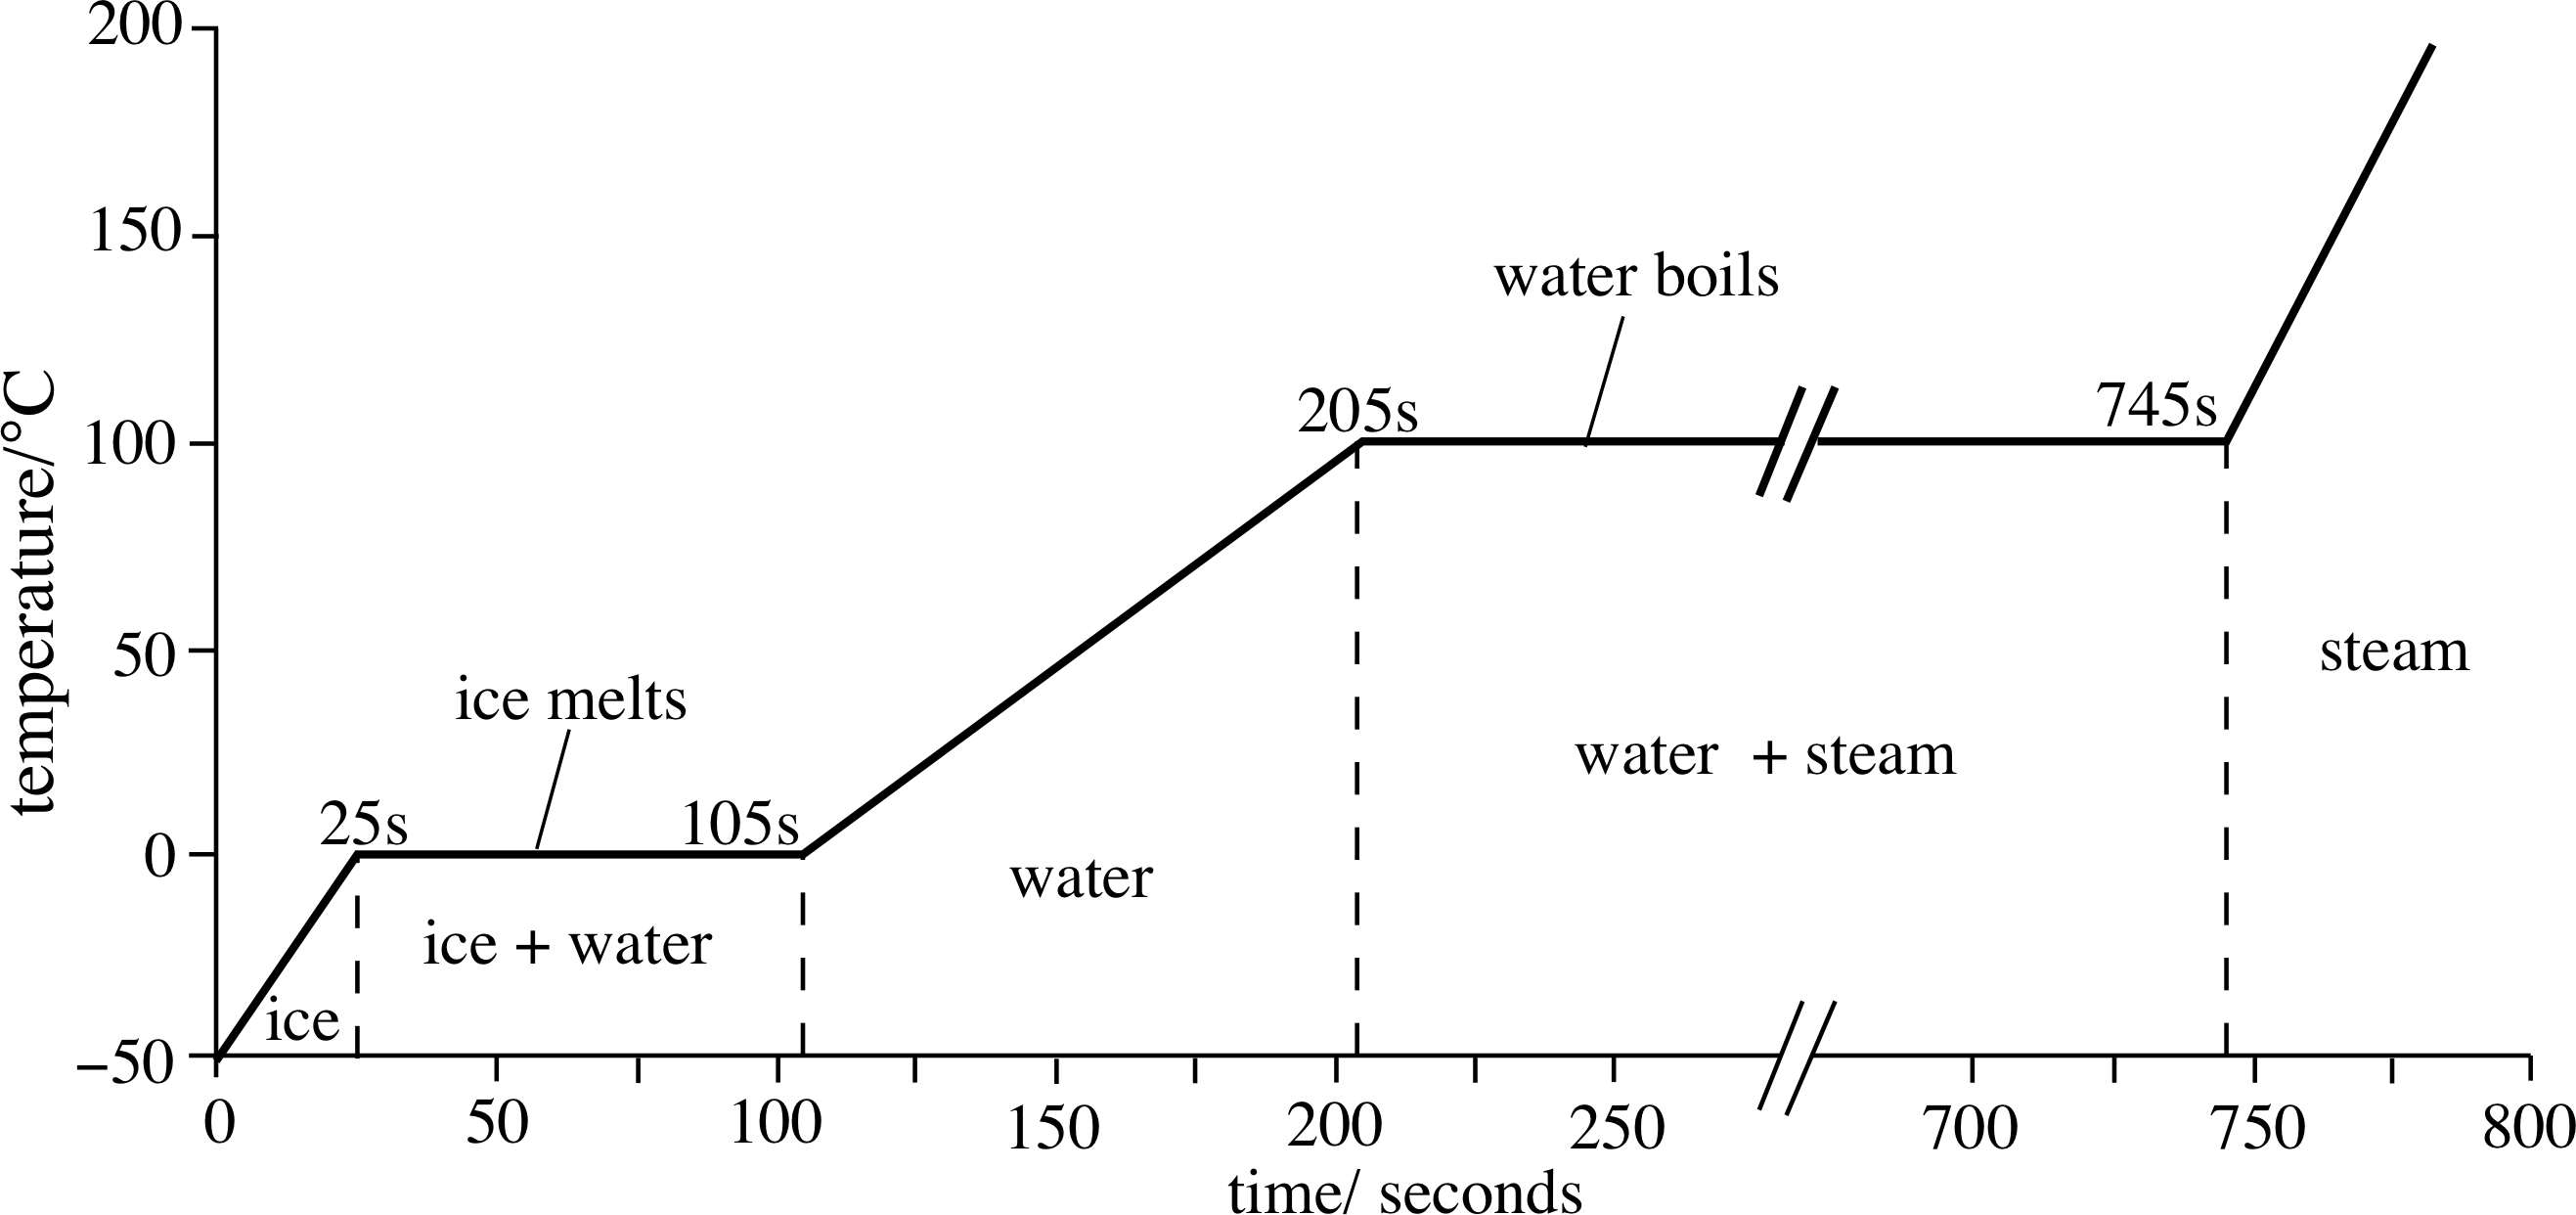
What is the profile of the graph of temperature versus time, when water as a block ice is heated, and the temperature of the ice, water, and steam are periodically monitored?
2 Answers
Aug 5, 2017
The solid-liquid transition temperature for water at normal atmospheric pressure is 0'C.
Explanation:
Melting points are a temperature, affected by pressure, but not by the surrounding temperature.
Aug 5, 2017
For the reaction.....
Explanation:
You might remember the experiment you did in the laboratory in this context....
....where temperature is plotted against time....typically you get..

In the presence of ICE and water, the temperature remains constant at


